UNDP published a post seeking innovators to build digital tools for crisis impact reporting.
The challenge is seeking end-to-end digital solutions (an ‘app’) that can enable community crowdsourcing for damage assessment in the aftermath of sudden-onset crises. The app to-be-built called ‘RAPIDA’ (Rapid Post-Crisis Integrated Digital Assessment) is UNDP’s flagship methodology for early recovery needs assessment.
The challenge is hosted through Wazoku’s Innocentive global solver community with a prize cap of US$50,000 awarded to the solution that meets the technical and operational requirements.
The Challenge
UNDP’s requirements for ‘RAPIDA’ app are clear and straight forward:
A public-facing interface with the ability to:
Accept photos, descriptions and damage classification
Interactive map overlay with footprints
Clear submission format
6 official UN language system
The administration of ‘app’ by UNDP’s team (backend):
Collect, validate, storing and exporting data
Scalable database that can support multiple records from image, geolocation data etc
When I read the challenge requirements, one sentence stopped me: 'ordinary folk who have access to smartphones.' That changed everything.
I started to think about the problem. UNDP's RAPIDA methodology uses satellites to assess crisis damage within 72 hours. But satellites cannot tell you if a hospital is still open.
They cannot see if debris is blocking the only road out of a neighbourhood. Communities can. The gap between what satellites see and what people on the ground know is where lives are lost.
I also looked into some tools UNDP provided: Ushahidi, KoboToolbox, Esri, Crisis Track. They all share the same blind spot: they are designed for trained field assessors, not for a person in crisis holding a cracked phone with one bar of signal.
Because, RAPIDA is UNDP’s flagship methodology for early recovery needs assessment, there is already a system working. My discovery (i.e. UNDP’s requirements), is system communities will use, extremely accessible interface with offline capabilities and features, reporter’s safety and privacy. Works seamless with any mobile phone with a camera and internet.
So I made three decisions:
Build RAPIDA’s visual identity and design system.
A trauma-informed and redemptive design system grounded in psychological safety. No red, it triggers stress. Big touch targets, for shaking hands. Simple language, reviewed through a conversational design framework.
Build Whatsapp as a full reporting channel
a complete multi-step damage report, from photo to confirmation, inside a WhatsApp conversation. No app download needed. No website. Just a phone number.
A system built not to track reporters
Build a mode where the RAPIDA system deliberately limit itselfs to protect the user. No identity tracking. No traces on the device. The phone stays clean. The server holds the evidence.
Brainstorming conversations i was having with myself
Our Approach
RAPIDA visual identity
Discovery kept circling back to one word: speed. Not speed as in working fast, speed as in compressing 72 hours of crisis reporting into 48.
Speed needed a shape. A lightning bolt, universal, urgent, recognizable in any language. Because RAPIDA lives in the hands of communities reporting under pressure, the mark had to read in a glance. Two variants carry it: a standalone logomark, and the logo with wordmark.
Every screen in RAPIDA started here, pencil on paper. Before tokens, before components, before a single line of Tailwind, the crisis map interface was drawn by hand: the report button, the damage-level legend, the safe-exit affordance, the recent reports stream. Sketching first kept the thinking honest. Pixels can hide indecision. Pencil can't.
Sketching RAPIDA's map interface before writing a line of code.
With the visual identity and the design system in place, the next question was where to put them.
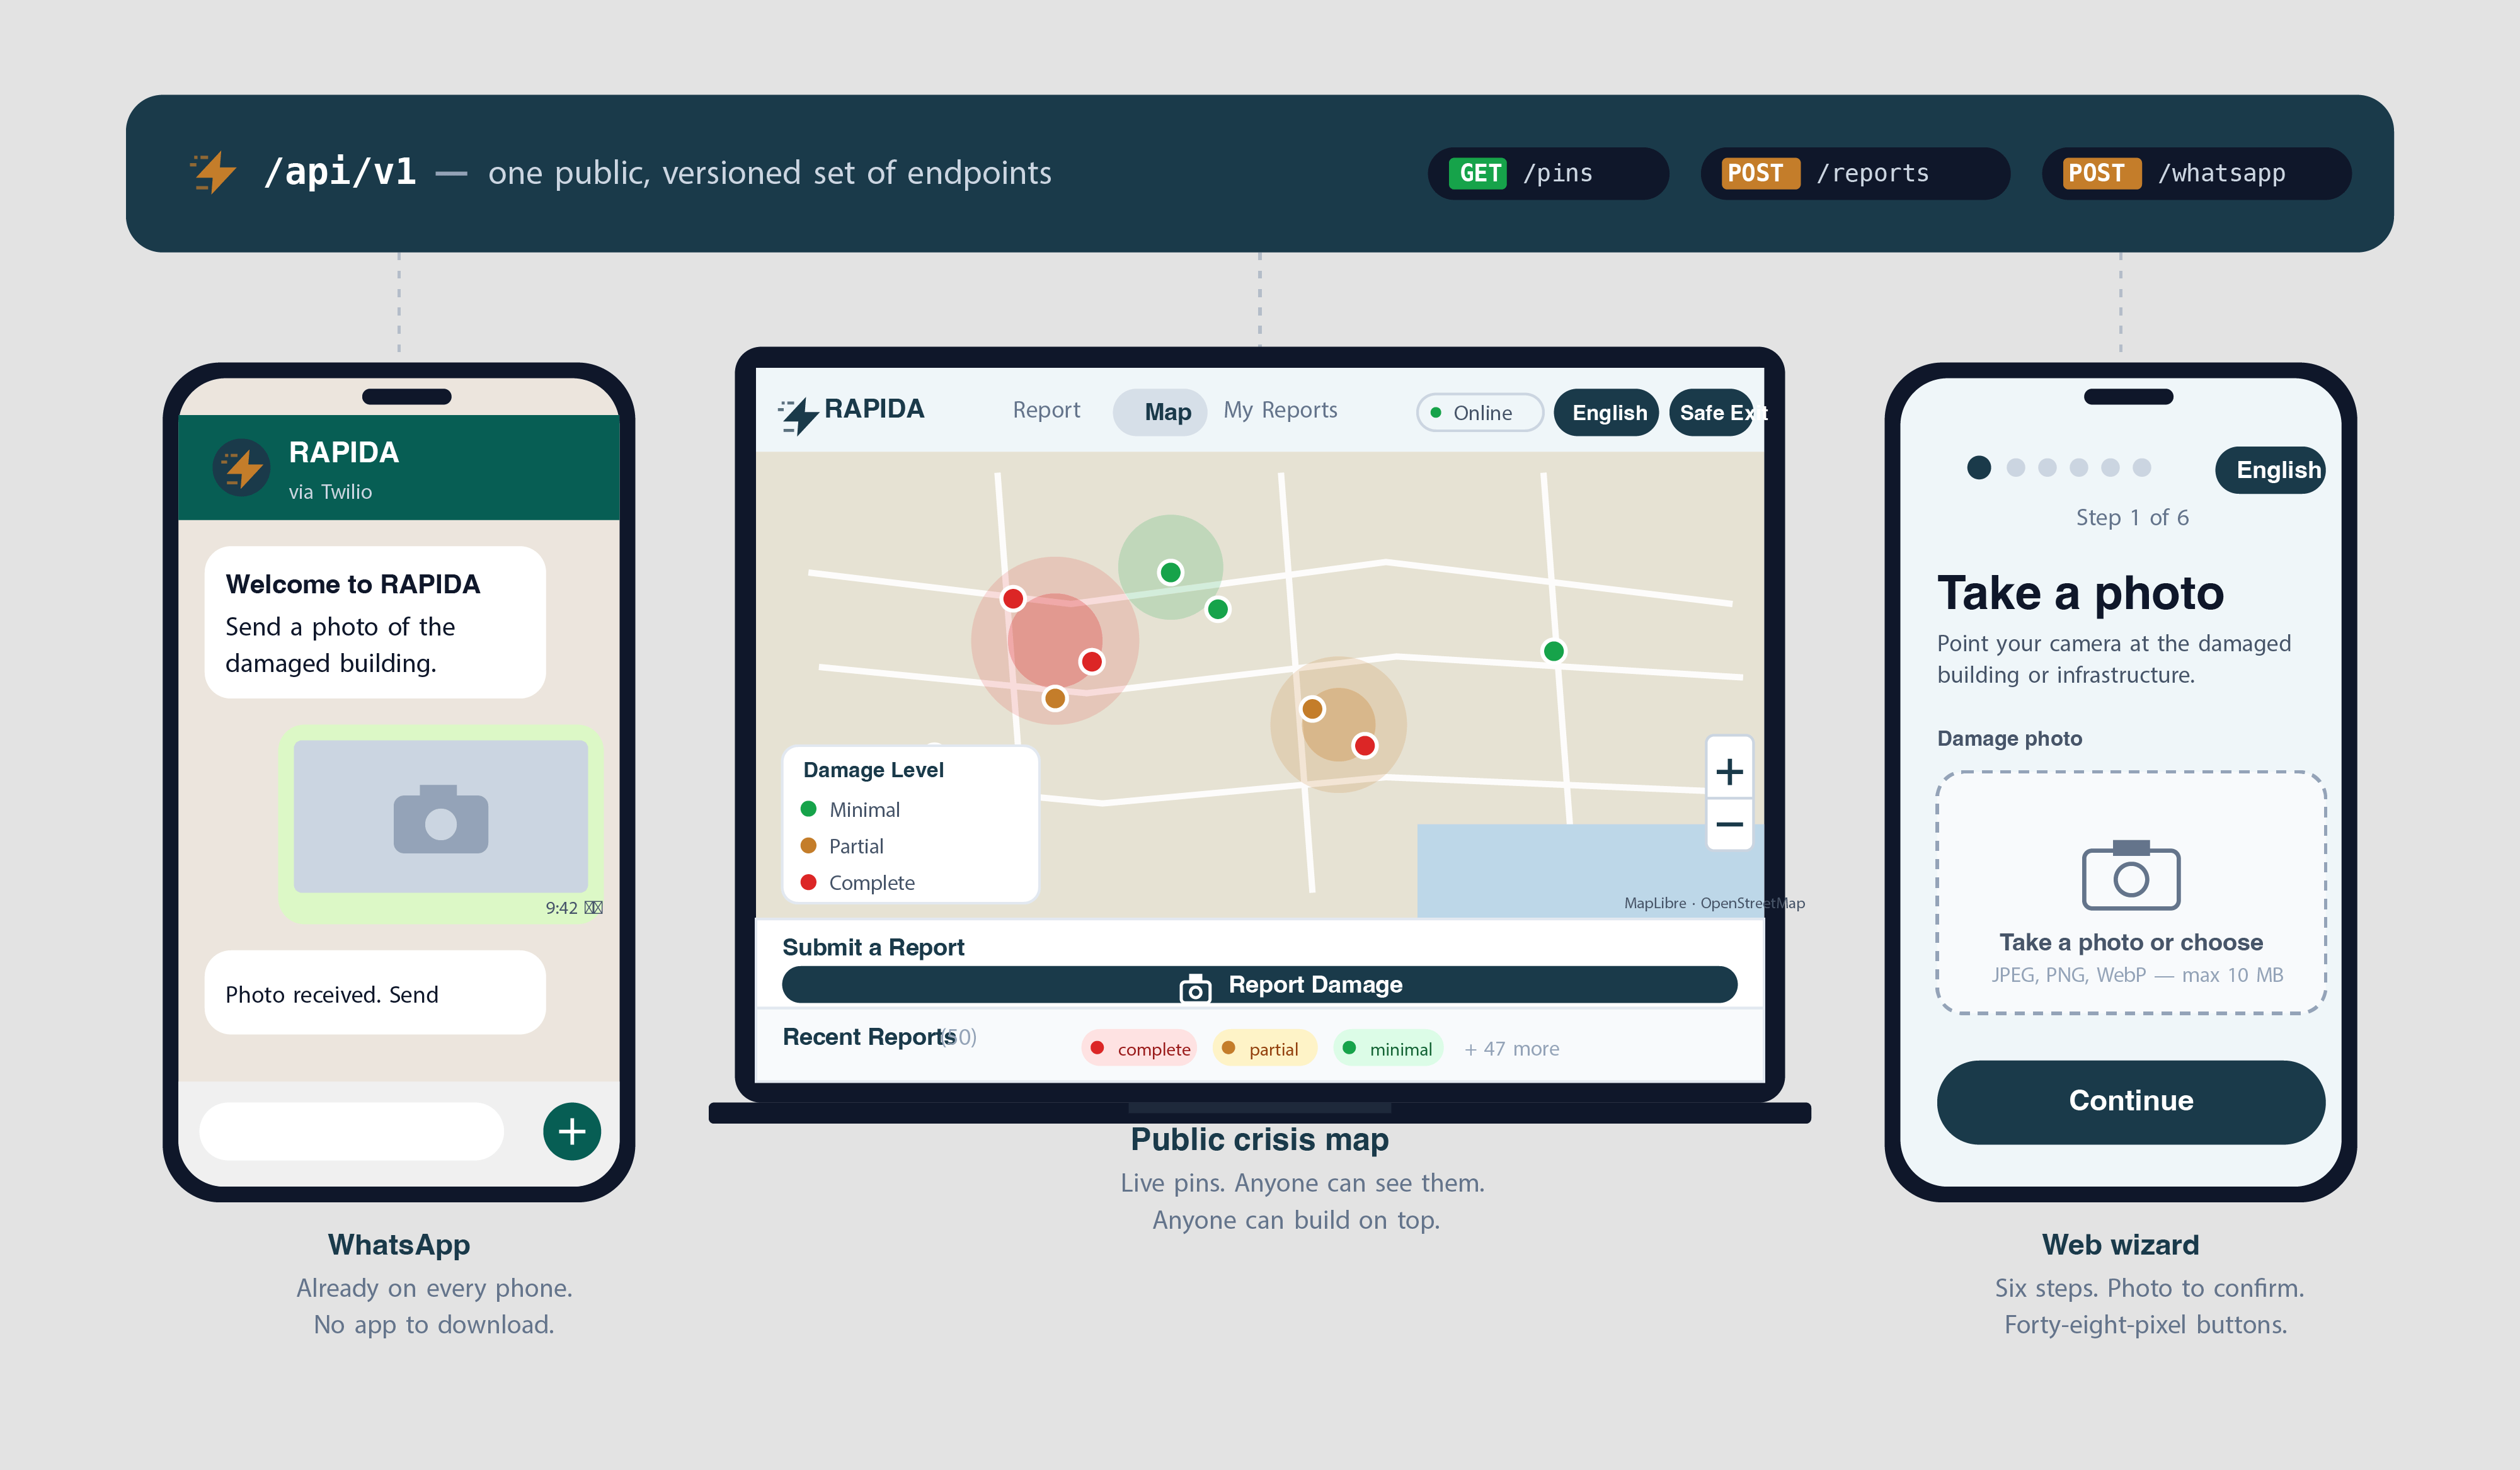
So RAPIDA App was built end-to-end as a working prototype, a public crisis map, a step-by-step web reporter, a WhatsApp conversation, and a clean API behind all of it.
Built to a working prototype standard (Technology Readiness Level 7): a system demonstrated in an operational environment, ready for community-scale field testing in a real crisis.
RAPIDA app: Open-source from top to bottom. Live and testables as you read this.
How it works on Whatsapp
WhatsApp was the first decision and the last refinement. Most people in a flood already have it. They don't have a new app to download. They don't have ten free megabytes to spare for one.
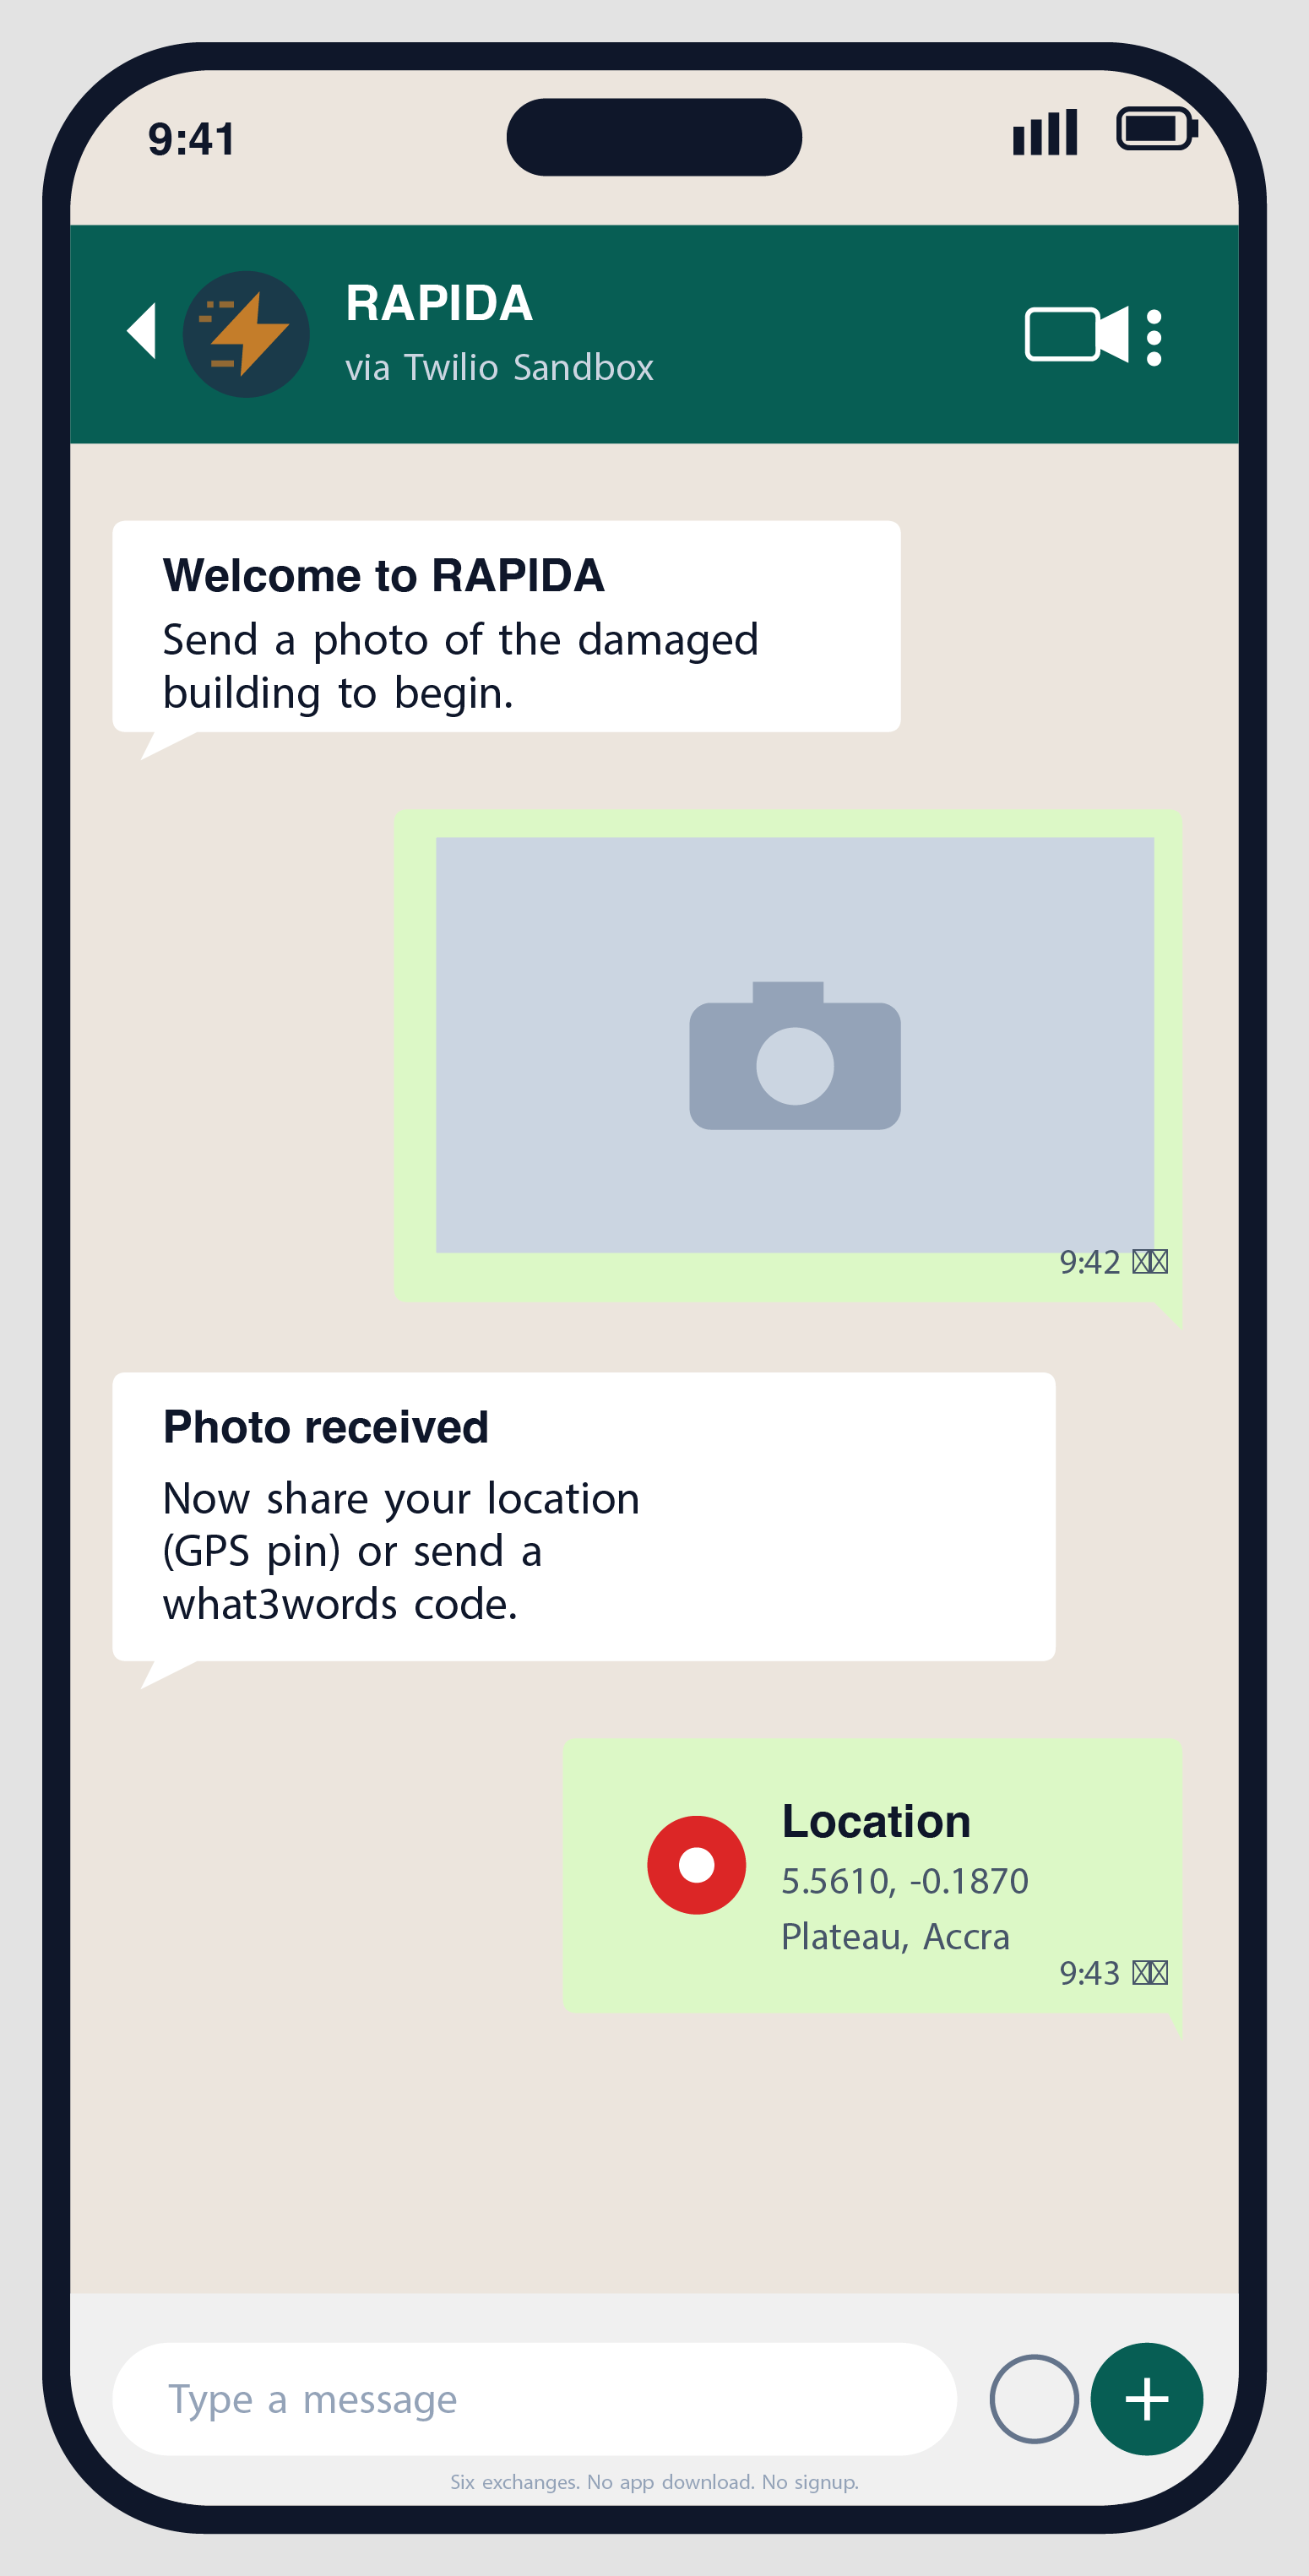
A reporter texts a single keyword to a sandbox number. The conversation opens with one ask: send a photo. Then a location pin. Then a tap to confirm the damage level, the type of building, whether debris is blocking access. Then `CONFIRM`. That's it. Six exchanges, no app store, no signup form.
The bot speaks all six UN languages. It detects the language from the user's first message, defaults to the crisis's primary language otherwise, and never assumes. If someone gets stuck, `RESTART` wipes the slate. If someone changes their mind, `STOP` cancels everything.
What makes the system feel calm under pressure is what it doesn't do. It doesn't ask for a name. It doesn't track the device. It accepts a photo with no GPS, a location described in three words, or a landmark like "behind the central market." Every step has a fallback. Every fallback is honoured.
RAPIDA's whatsapp flow
How communities use it
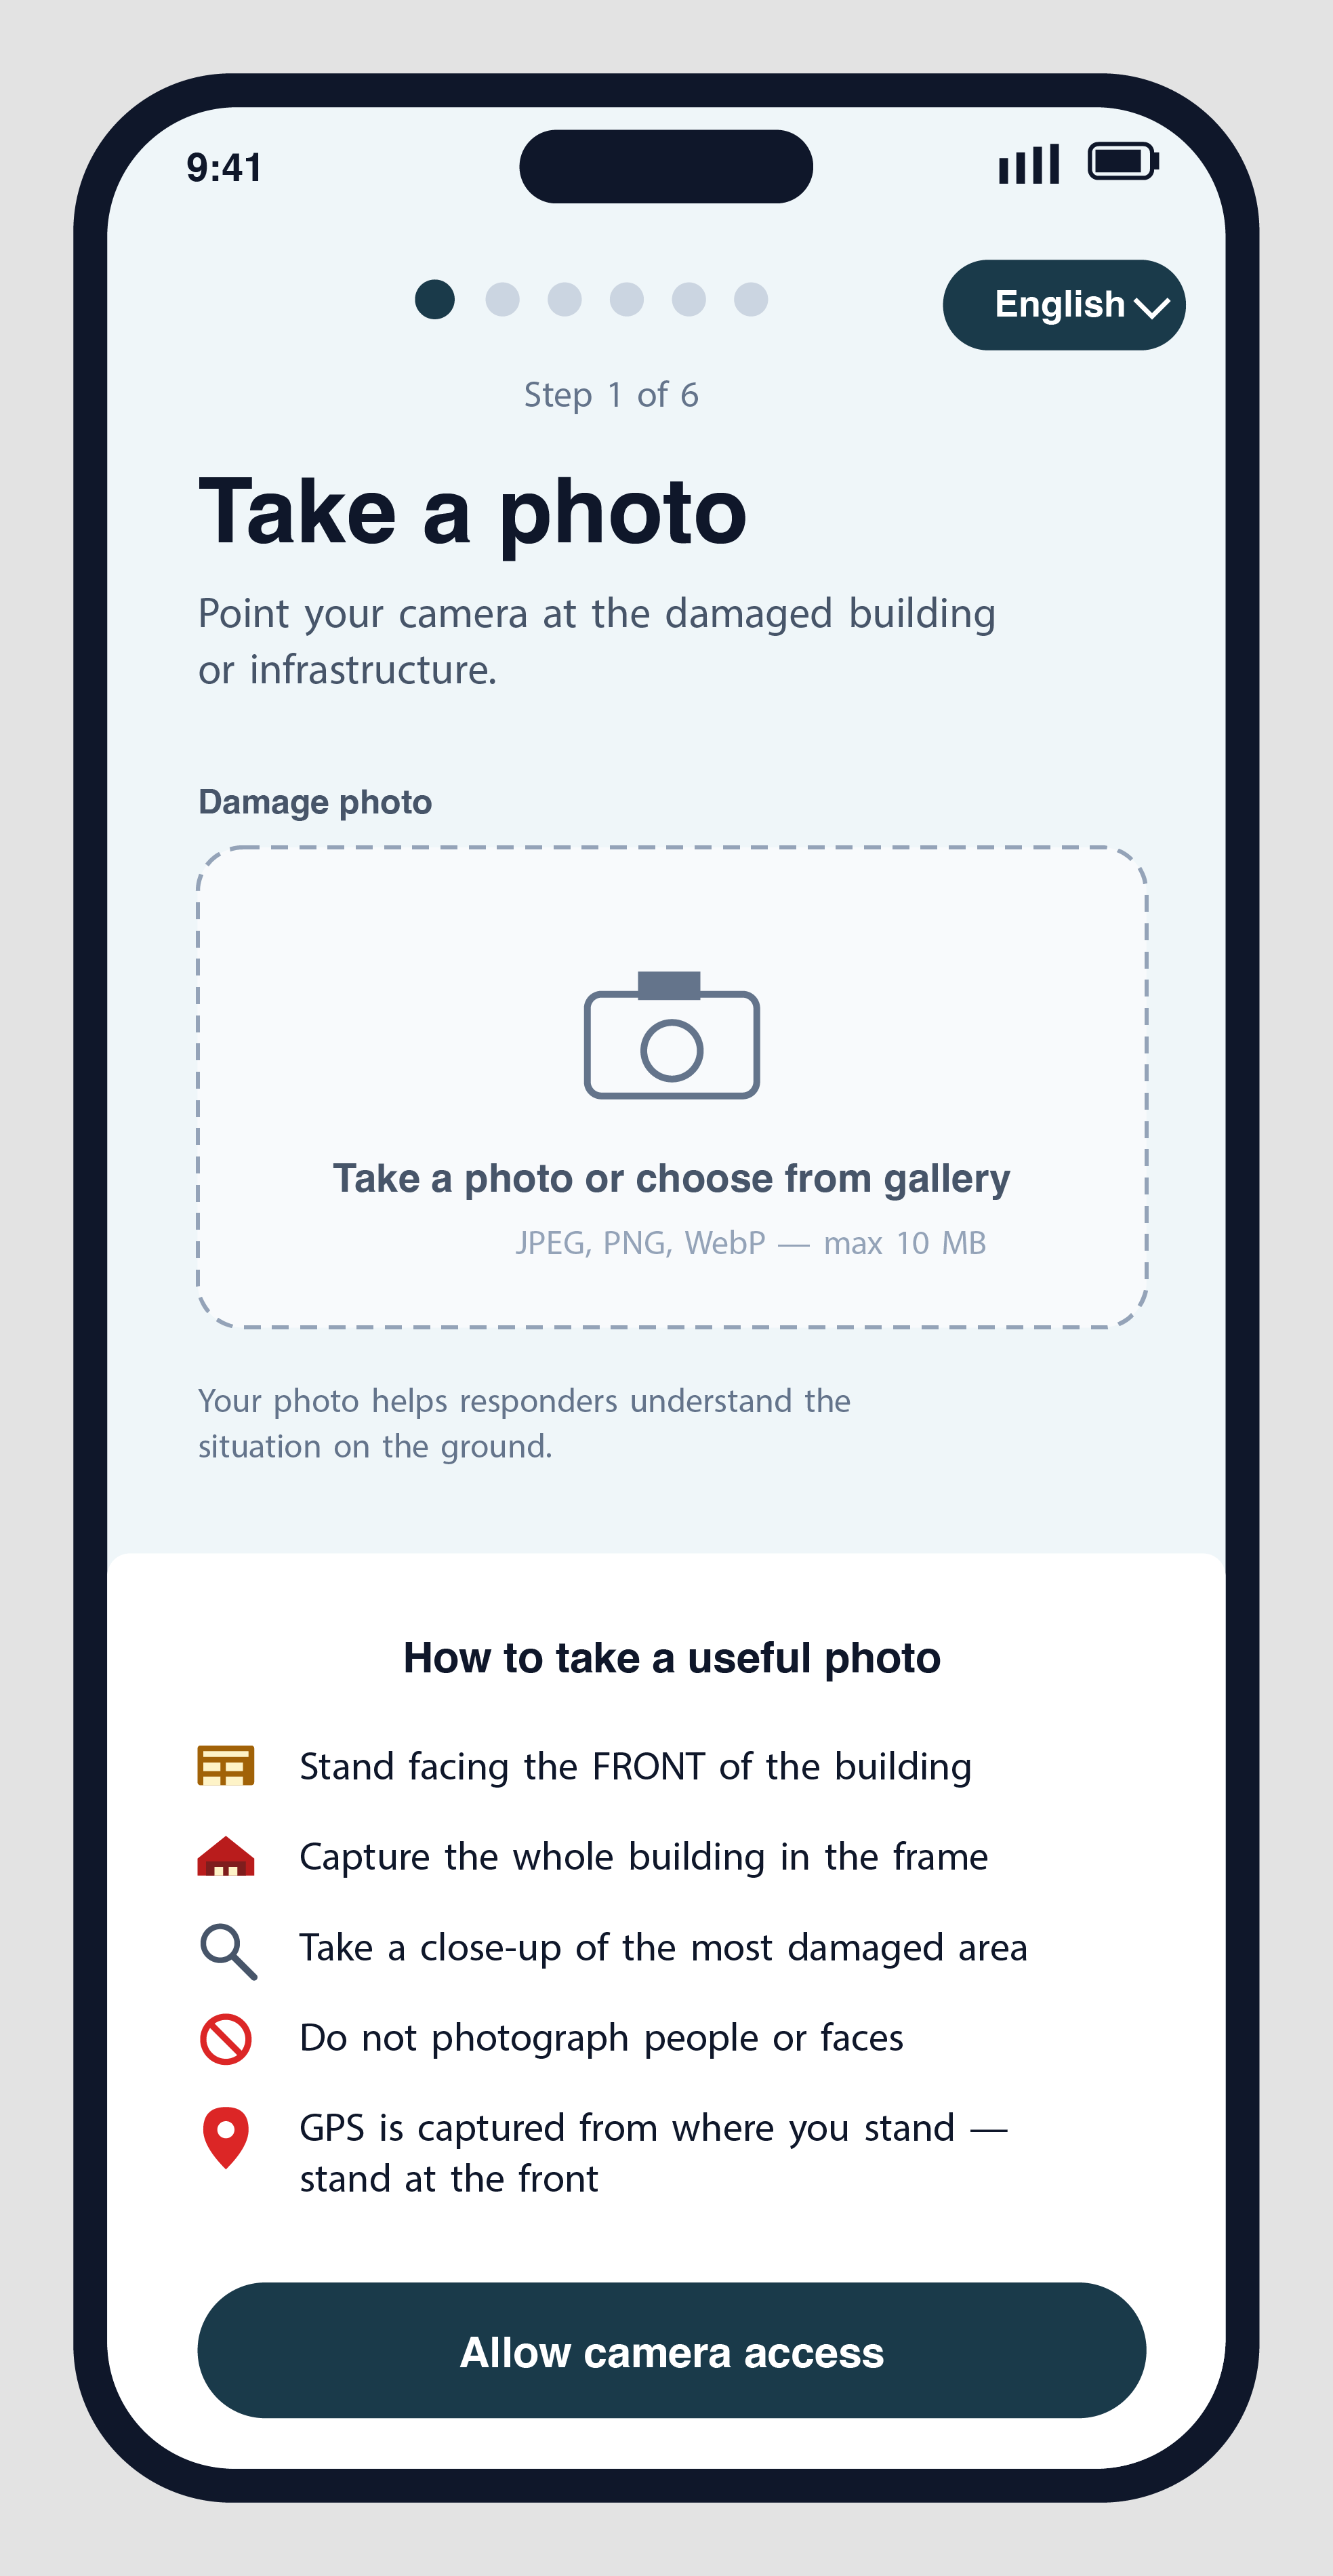
The web reporter is a wizard. Six steps, photo to confirmation.
It starts with the photo because the photo is the proof. The wizard tells you what makes a useful one, stand at the front, capture the whole building, no faces. It tells you why the front matters: GPS is captured from where you stand. It assumes you're working with shaking hands and a cracked screen, and so the buttons are forty-eight pixels minimum and the colours stay calm.
Multiple photos of the same damage? Up to three, optional, after the first. A second from a different angle. A third for the worst-hit room.
The reporter sees their own work appear on the public map within seconds, blurred until a moderator clears it but visible enough to know it landed.
A community that watched its neighbourhood flood now watches its neighbourhood report.
If the connection drops mid-flow, the wizard remembers. If the reporter is in a conflict zone, the system flips into anonymous mode automatically, no fingerprint, no cookie, no trace. The phone stays clean.
How communities use RAPIDA
How the map shows damage
Satellite imagery tells you a building exists. It cannot tell you whether the hospital is still admitting patients or whether the school's only stairwell is blocked. Satellites map structures. Communities map reality.
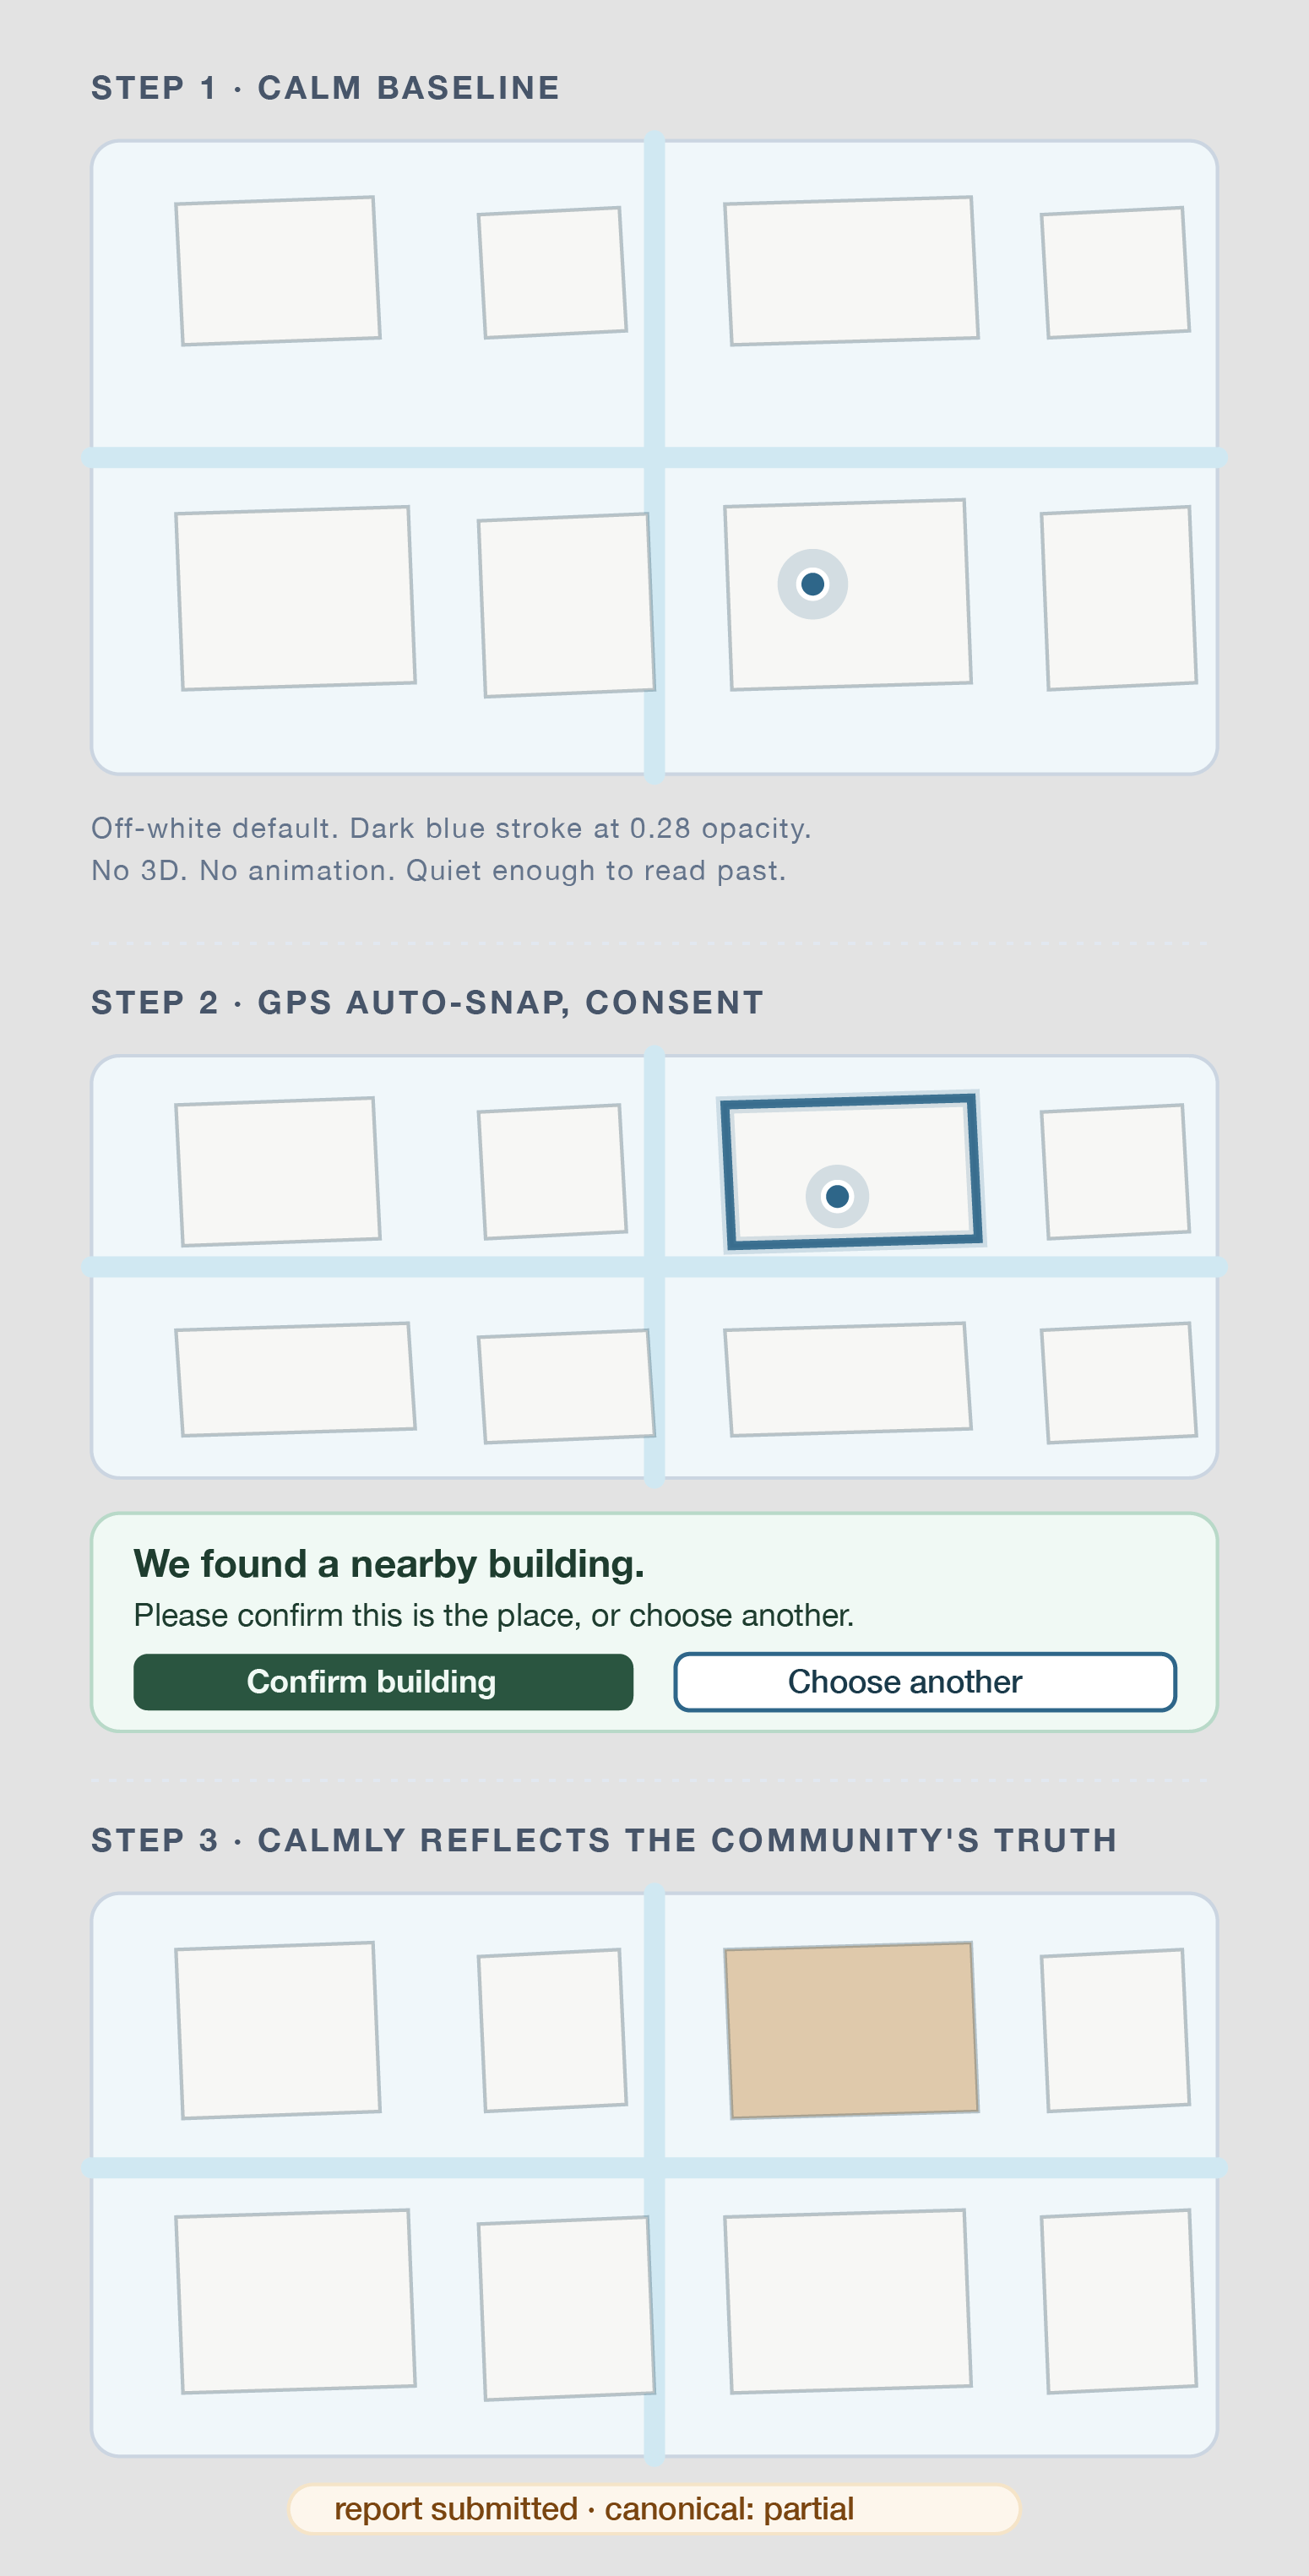
The map renders every report as a calm 2D building footprint, not a pin. Off-white at rest, dark blue stroke at low contrast, visible enough to know "this is a structure," quiet enough that the basemap stays readable. No 3D extrusion, no terrain tilt, no animation. A map a person can look at without flinching.
When the wizard captures GPS, the map asks the server which footprint is nearest. If a building is within thirty metres and the GPS fix is precise enough to trust, the map outlines it in rapida-blue and surfaces a confirmation card: "We found a nearby building. Please confirm this is the place, or choose another." The reporter is never auto-committed to a guess.
Submit a report and the building changes, gently, to the canonical damage state. Ground-green if a structure stands. Alert-amber if it's partial. Crisis-rose if it's complete. Never red. Never flashing. The map tells the story the community is telling, in the colours the community decided.
The whole thing works on a four-year-old Android with one bar of signal.
RAPIDA's 2D map
How UNDP staff use it
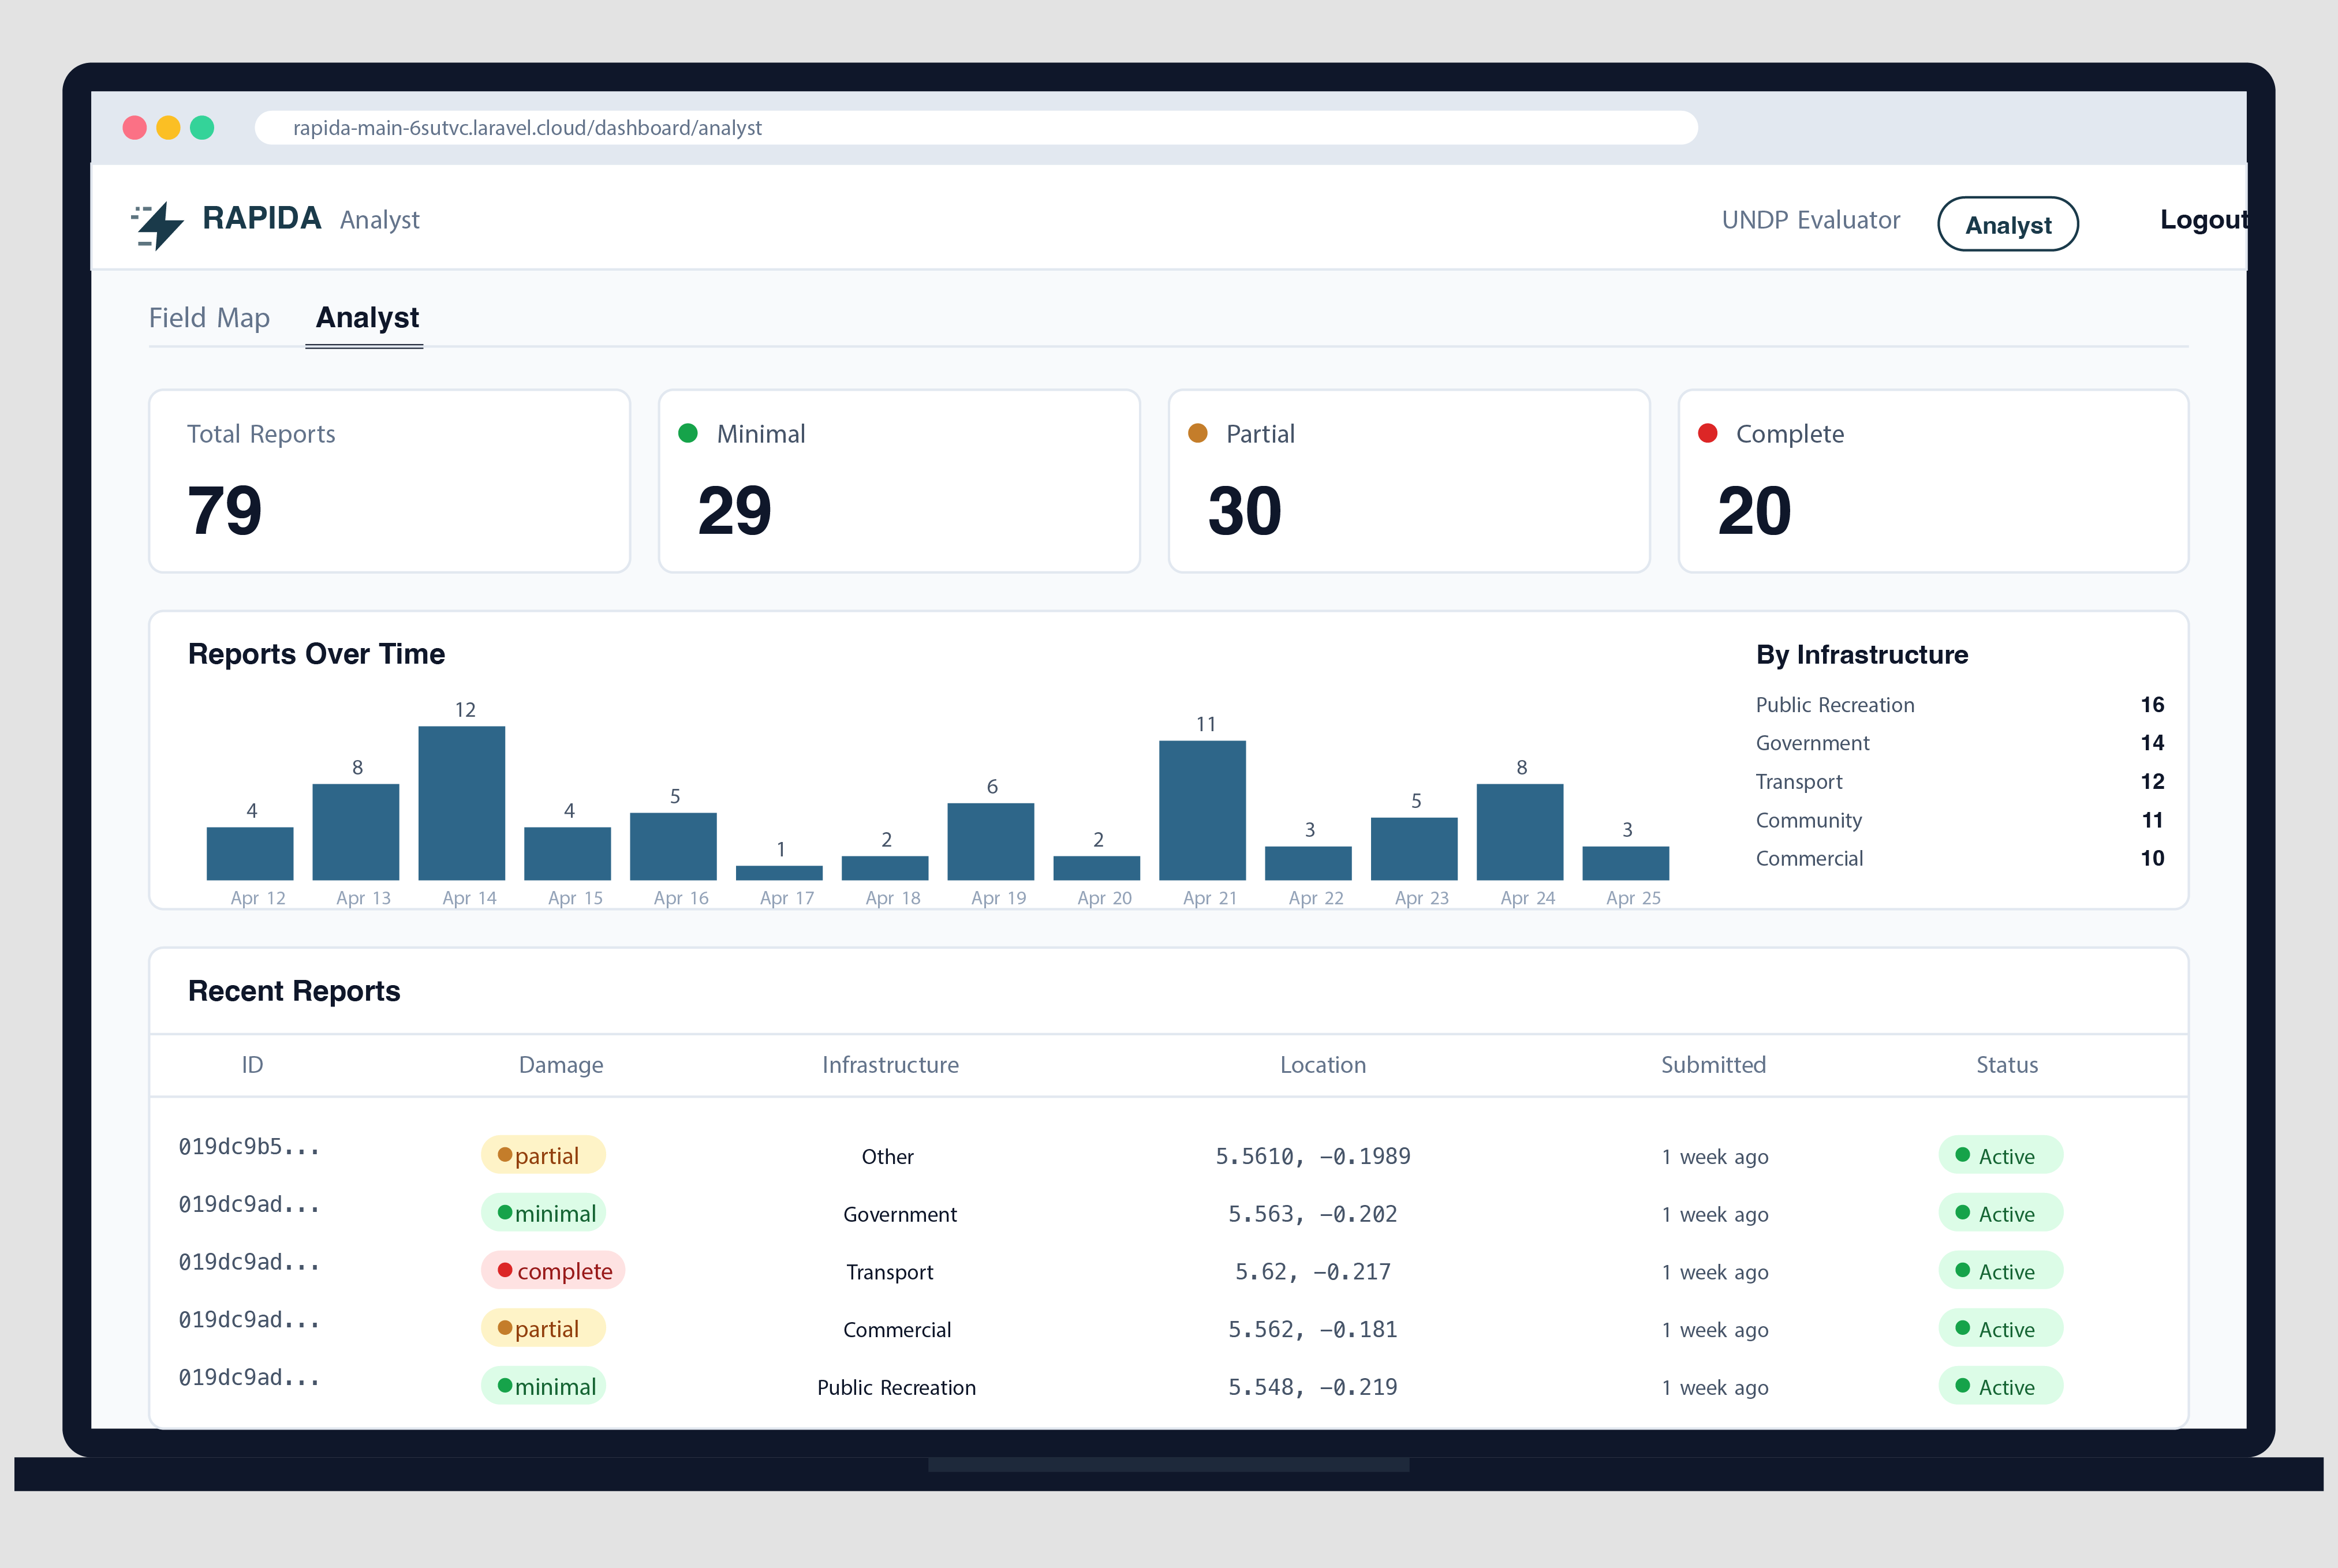
The other side of the same database is an analyst dashboard. Quiet, structured, no surprises.
Reports land in a queue. An analyst opens one, reviews the photo, cross-checks against the building footprint, marks it verified or asks for clarification. Each action is logged. Each action is reversible.
The map view shows everything at once: a heatmap of where reports are clustering, individual pins where someone said "here," and a sidebar of the latest fifty reports with damage levels, photos, and where the reporter walked from. The data exports in every format a recovery team might already use: CSV for spreadsheets, GeoJSON for GIS, Shapefile for ESRI tools, KML for Google Earth, GeoPackage for offline use.
The work products of a damage assessor are the work products RAPIDA hands them.
There's a smaller, slower job running under the surface: an AI helper that classifies damage from the photo before any human looks at it. The analyst sees the AI's suggestion alongside their own judgement. They can agree, override, or flag. The system doesn't replace the human, it gives the human a head start.
How UNDP staff use RAPIDA
How RAPIDA's API works (Application Programming Interface)
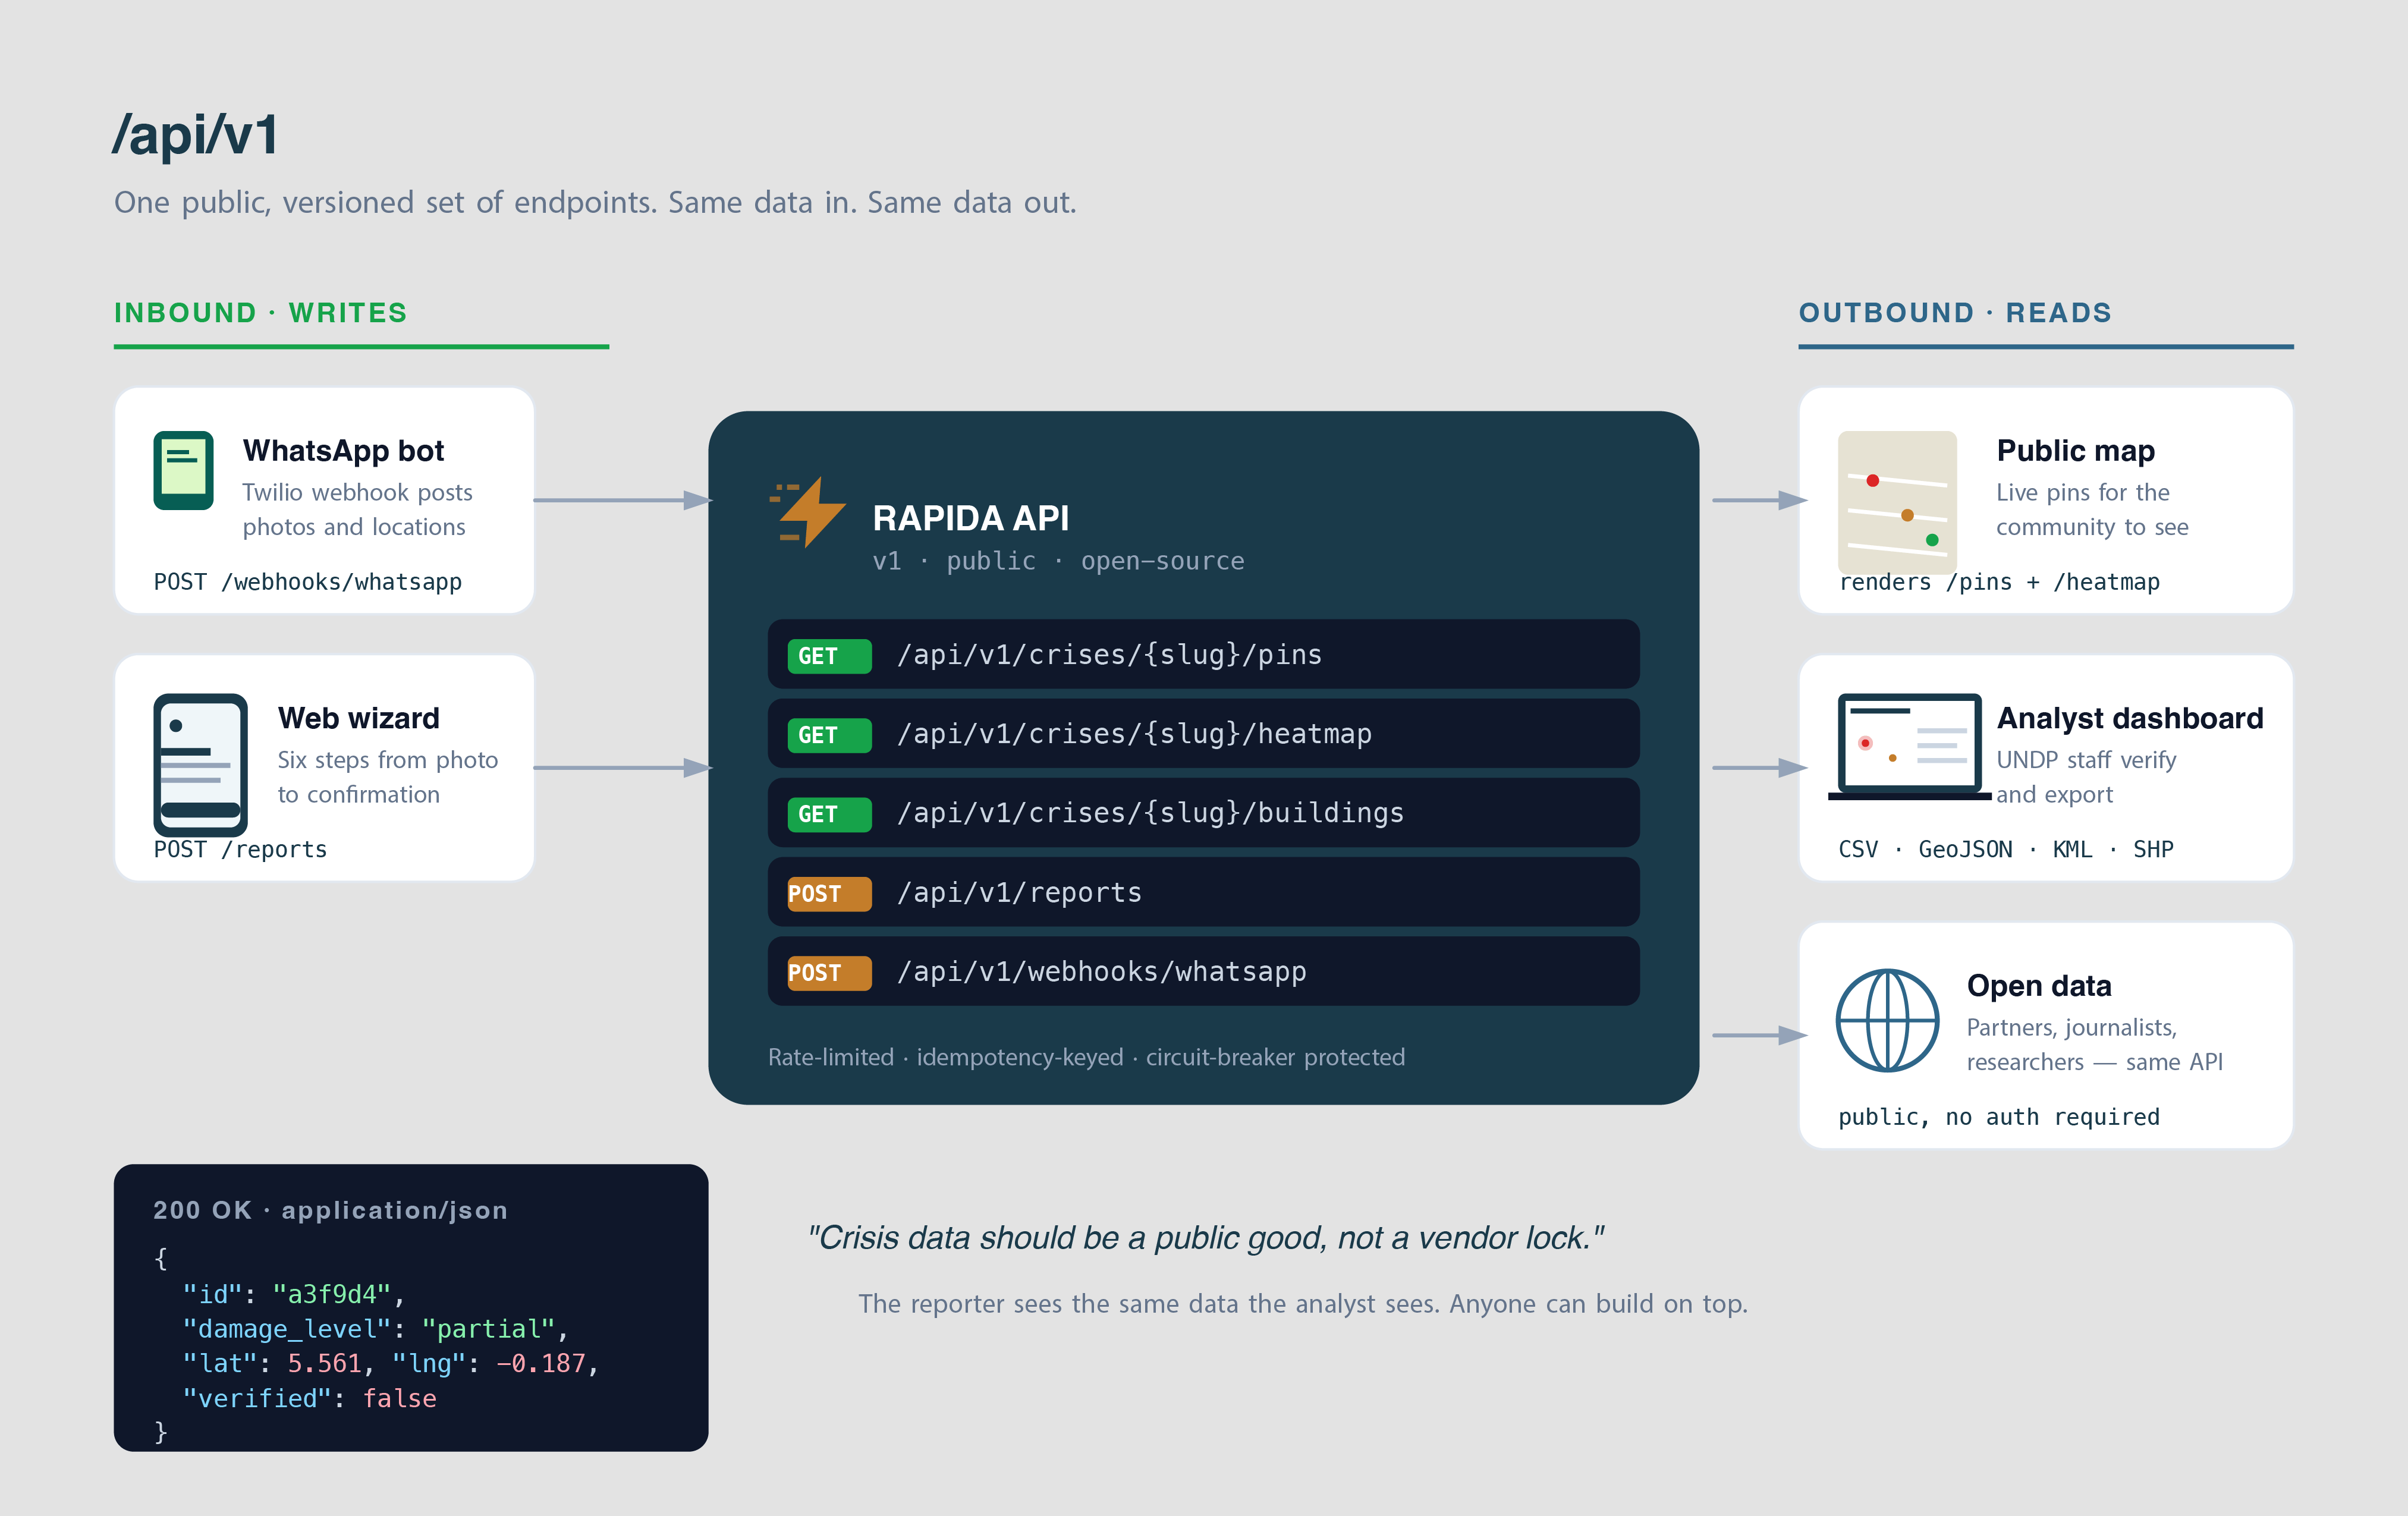
The API is what makes everything else possible. A single, public, versioned set of endpoints that the web reporter, the WhatsApp bot, and the analyst dashboard all share.
Every pin the reporter sees is built from the same data the analyst sees. The building footprints. The heatmap. The recovery outcomes. All served from `/api/v1/`. Anyone can fetch them. Anyone can build on top.
Inbound, a reporter sends a photo through WhatsApp; the gateway hits a webhook; the API verifies the signature, validates the data, stores the photo in object storage, writes the report. The reporter gets a confirmation in under a second. The map updates the moment a moderator approves.
Outbound, the same data flows out, to partners coordinating relief, to the public map, to open-data feeds for journalists and researchers. Crisis data should be a public good, not a vendor lock.
Every API decision was made with one question in mind: what happens when the network is bad? Rate limiting is gentle to phones with one bar of signal. Idempotency keys mean a retry never duplicates a report. Circuit breakers mean a slow translation service never blocks a real submission. The system bends so the reporter doesn't have to.
RAPIDA's API
Built with
A small open-source stack, credited in full:
Laravel, Livewire, Alpine.js: the application layer.
Tailwind CSS, Blade: the design system.
Twilio: the WhatsApp gateway.
Cloudflare R2, Postgres: object storage and data.
MapLibre GL JS, PMTiles: the open-source 2D map renderer and tile protocol.
OpenStreetMap: basemap tiles, ODbL.
Microsoft Global ML Building Footprints: open building outlines for Accra, CDLA Permissive 2.0.